For decades, cricket has been described as a gentleman’s game – one of skill, strategy, and glorious uncertainty. But in the modern era, particularly with the advent of T20 leagues and sophisticated broadcasting, it’s also become a game of numbers. From wagon wheels to pitch maps, worm graphs to strike rates, statistics are everywhere.
But are you truly using these stats to enhance your viewing experience, or are they just background noise?
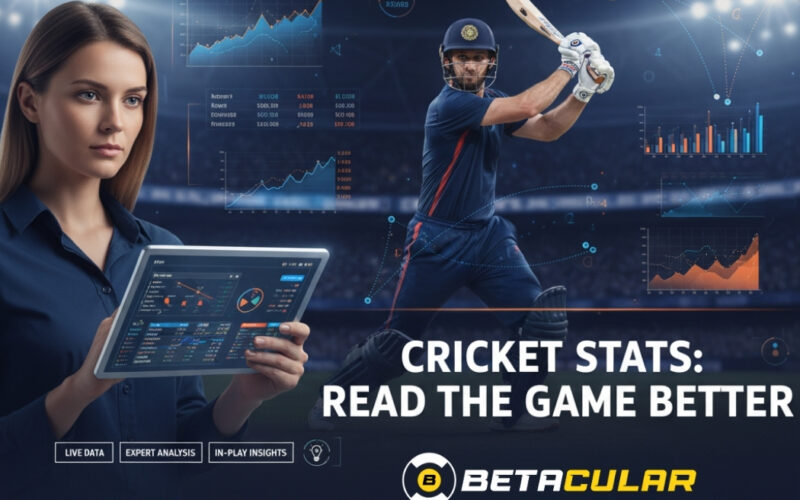
At betacular.in (replace with your internal link), we believe that the informed fan is the most engaged fan. Understanding how to interpret match statistics isn’t just for commentators or professional analysts; it’s a powerful tool for every cricket enthusiast to read the game better, anticipate outcomes, and truly appreciate the tactical battles unfolding on the field.
Let’s dive into how you can become a ‘smart viewer’ this season.
Beyond the Scorecard: Key Stats to Watch
While the runs and wickets tell you the “what,” a deeper dive into the numbers reveals the “how” and “why.”
- Run Rate & Required Run Rate (RRR):
- What to watch for: In limited-overs cricket, these are paramount. If the batting team’s current run rate is significantly lower than the RRR, it signals increasing pressure and potential risks.
- Insight: A sudden spike in run rate with high-risk shots often indicates desperation or a strategic shift. Conversely, a steady run rate nearing the RRR suggests control.
- Strike Rate (SR) & Economy Rate (ER):
- What to watch for: A batsman’s SR (runs per 100 balls) tells you about their aggression. A bowler’s ER (runs conceded per over) indicates their control and wicket-taking potential.
- Insight: A batsman with a low SR struggling on a particular pitch might be ripe for a wicket. A bowler with a high ER is likely being targeted or is having an off-day, signaling a potential change in bowling.
- Wagon Wheels & Pitch Maps:
- What to watch for: Wagon wheels show where a batsman scores their runs. Pitch maps show where a bowler lands their deliveries.
- Insight: If a batsman consistently scores through fine leg but struggles on the off-side, fielders might adjust. If a bowler is consistently hitting a specific length that yields wickets, they’re in a good rhythm. It helps you understand patterns and strategies.
- Boundary Percentage:
- What to watch for: The percentage of a batsman’s runs scored in fours and sixes.
- Insight: A high boundary percentage means they’re not just rotating the strike but finding the ropes, indicating aggressive intent and power.
- Dot Ball Percentage:
- What to watch for: The percentage of deliveries from which no runs are scored.
- Insight: For bowlers, a high dot ball percentage builds pressure. For batsmen, a low dot ball percentage shows good rotation of strike and prevents pressure from mounting.
- Partnership Runs & Rate:
- What to watch for: How many runs two batsmen have scored together and at what pace.
- Insight: A strong, rapidly growing partnership is the backbone of a good innings. Identifying a struggling partnership can hint at an impending wicket.
How Betacular Enhances Your Statistical Edge
Understanding stats is one thing; leveraging them is another. Betacular provides the perfect platform for the ‘smart viewer’ to put their insights into action.
Here are the benefits of choosing Betacular this cricket season:
- Live Match Statistics: Our platform offers real-time statistics for ongoing matches, allowing you to track all the critical numbers as they happen. See the updated run rates, partnership stats, and player performances instantly.
- In-Play Betting Options: Armed with live data, you can make smarter decisions with our dynamic in-play betting markets. Notice a bowler’s economy rate spiking? Bet on the next over to be expensive. See a batsman’s strike rate soaring? Predict them to hit a boundary.
- Expert Analysis & Tips: Beyond raw data, Betacular often provides expert analysis and pre-match insights that can guide your understanding and help you spot trends you might have missed.
- Best Market Odds: We offer competitive odds across a vast array of cricket markets, ensuring that when your statistical insights pay off, you get the best possible returns.
- Seamless User Experience: Our intuitive interface makes it easy to navigate through live scores, stats, and betting markets, ensuring you don’t miss a beat.
- Secure & Trusted Platform: Bet with peace of mind on a globally recognized and secure platform.
Become the Ultimate Cricket Analyst
Next time you’re watching a game, don’t just passively observe. Engage with the numbers. Watch how a captain manipulates the field based on a batsman’s wagon wheel, or how a bowler adjusts their length after a few expensive overs.
By actively integrating match statistics into your viewing, you’ll not only read the game better but also develop a deeper appreciation for the nuances and tactical brilliance of cricket. And when you’re ready to put your newfound analytical skills to the test, Betacular is here to provide the ultimate platform.
The Future of Cricket Engagement
The cricket experience is evolving — AI-powered analytics, interactive dashboards, and predictive engines like Betacular’s are redefining what it means to follow a match.
Whether it’s T20 fireworks or intense Test matches, fans who interpret data intelligently make viewing far more immersive.
So next time you tune in, don’t just cheer — analyze, understand, and enjoy the smarter way to watch cricket with Betacular.
Explore the comprehensive stats and competitive odds at Betacular.live. For an even deeper dive into cricket analytics and a seamless betting experience,